A biennial survey conducted by the National Society of Accountants (NSA) reported detailed data about business practices, client fees, and spending for tax and accounting professionals.
The 2016-17 NSA Income and Fees of Accountants and Tax Preparers in Public Practice Survey Report offers useful benchmarks for firms to use in billing, fee increases, engagement practices and other operations.
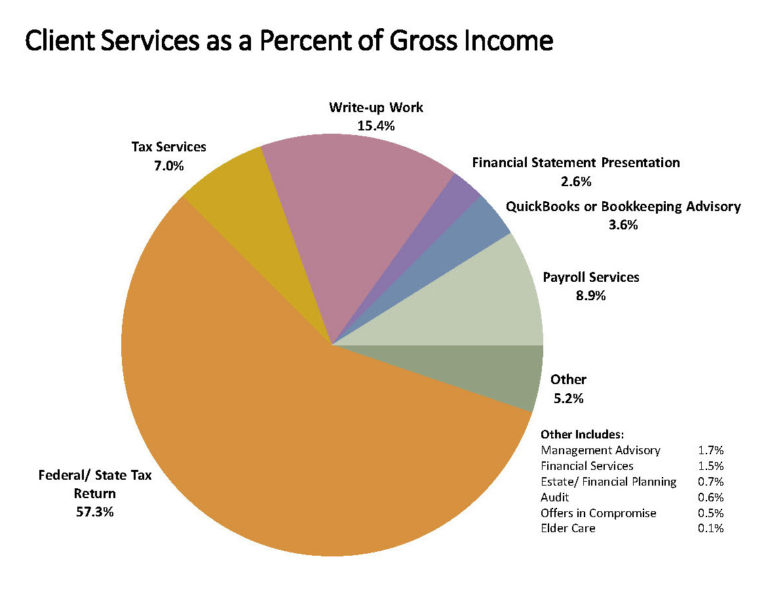
Business Mix and Revenue
Surveyed firms reported that on average 57.3% of gross income comes from tax-return preparation, 15.4% from write-up work, 8.9% from payroll services, 7.0% from tax services, 3.6% from QuickBooks/bookkeeping, 2.6% from financial statement presentation, and 5.2% from other services.
Firms split fairly evenly regarding billing methods for accounting services, with about a third billing by fixed fee (35.3%), hourly (31.2%) or a combination of the two (31.8%). Most bill for tax preparation by form (39.5%), hourly (8.4%), by a combination of fixed and hourly fees (25.0%) or by fixed fee only (23.2%).
Fees

The average fee charged to prepare an itemized Form 1040 with Schedule A and a state tax return is $273, and the cost for a Form 1040 without itemized deductions and a state return is $176.
Nearly half (49.8%) of tax and accounting practices increase tax preparation fees annually while 33.7% increase these fees every other year. For accounting fees, 37.4% increase fees annually, while 34.4% increase fees every other year.
Surveyed firms expected to increase their accounting service fees by an average of 6.1% in 2017, up from an actual increase of 5.3% in 2016.
Tax-preparation fees were expected to rise by higher percentages. Surveyed firms expected to increase tax-prep fees by an average of 6.4% in 2017, up from an actual increase of 6.0% in 2016.
Nearly three quarters (71%) charge an added fee for disorganized or incomplete files. Another 33% charge an additional fee for file extensions, 22% charge an additional fee for information received after a set deadline, and 24% charge an additional fee to expedite returns.
Average hourly fees for various client services include:
- Offers in Compromise – $177
- Estate/Financial Planning – $163
- Audit of Financial Statements – $157
- Financial Services – $144
- Tax Services – $145
- Management Advisory Services – $146
- Elder Care Financial Services – $131
- Financial Statement Presentation – $134
- QuickBooks or Bookkeeping Advisory Services – $97
- Write-up Work – $93
- Payroll Services – $83
Average fees to prepare forms include:
- $273 for a Form 1040 with a Schedule A and state return
- $176 for a Form 1040 (non-itemized) and a state return
- $184 for a Form 1040 Schedule C (business)
- $124 for Schedule D (gains and losses)
- $135 for Schedule E (rental)
- $180 for Schedule F (farm)
- $656 for a Form 1065 (partnership)
- $826 for a Form 1120 (corporation)
- $809 for a Form 1120S (s corporation)
- $482 for a Form 1041 (fiduciary)
- $733 for a Form 990 (tax exempt)
- $69 for a Form 940 (federal unemployment)
- $1,563 for a Form 706 (estates)
- $413 for a Form 709 (gift tax)
- $242 for a Form 8824 (like-kind exchanges)
- $532 for a Form 5500 (pension/profit-sharing plans)
- $282 for a Form 3115 (application for change in accounting method)
- $59 for a Form 8962 (premium tax credit calculation)
- $53 for a Form 8965 (health coverage exemptions)
- $58 for a Form 1095‐A (health insurance marketplace statement)
- $57 for a Shared Responsibility Payment Calculation
Fees vary by region, firm size, population and economic strength of an area. The average tax preparation fee for an itemized Form 1040 with Schedule A and a state return in each U.S. census district are:
New England (CT, ME, MA, NH, RI, VT) – $333
Middle Atlantic (NJ, NY, PA) – $290
South Atlantic (DE, DC, FL, GA, MD, NC, SC, VA, WV) – $268
East South Central (AL, KY, MS, TN) – $210
West South Central (AR, LA, OK, TX) – $271
East North Central (IL, IN, MI, OH, WI) – $249
West North Central (IA, KS, MN, MO, NE, ND, SD) – $214
Mountain (AZ, CO, ID, MT, NV, NM, UT, WY) – $263
Pacific (AK, CA, HI, OR, WA) – $329
Audits
The majority of those surveyed (58.3%) have not seen any change in the number of audits. The average hourly fee for an in-person IRS audit is $150 and the average fee for an IRS audit response letter is $128.
Only 8.8% of preparers never charge for an audit response letter. Sixty-two percent charge for IRS audit response letters when the return was prepared by another party; 47.5% charge when they are not at fault for a return they prepared and 10.3% always charge or an IRS response letter.
Dispute Resolution
Most practitioners (80%) are fortunate to not have been involved in any client disputes during the last year. When asked how often they review problem clients, most practitioners (80%) said they do so as problems occur. Those surveyed rank raising fees first (59%) and disengaging second (49%) as the most likely options for handling problem clients.
Most practitioners pay all of the interest and penalties for errors that are totally or partially the fault of the practitioner.
Practice Procedures
The vast majority of tax and accounting professionals (89%) offer free consultations. Most bill clients at the end of jobs (67.8%), while 18.7% use progress billing and 9.7% require a percentage of the payment due with the engagement letter. A total of 41.5% now accept credit card payments – up from 37.2% two years ago.
Engagement letters are required by 58.0% of accountants for tax preparation and 42.7% for accounting work.
Most practices (54%) are now using secure web portals or cloud platforms to share files with clients compared to 2014 when most did not (56%). When collecting data from clients, more now report their clients upload documents into a secure filing sharing program compared to 2014 – 7.8% vs. 2.9%. However, the face-to-face, in-person interview is still the most popular way to collect data from clients with 44.1% of practitioners conducting in-office client interviews (down from 45.7% in 2014).
Operating Expenses
The survey found that practices’ greatest expense is salaries and benefits (38.1% of expenses), followed by technology (11.8%), occupancy (10.3%), office supplies (8.9%), and education (6.7%).
The average number of employees is down to 3.5 from 4.2, but practices are now hiring more seasonal employees – up to an average of 3.2 from 2.3. The average gross income per full-time employee in a practice has increased to $100,212.
Most other specific operating expenses as a percentage of total expenses have slight increases, most notably, allocation for technology expenses is up 2.1%.
Complete survey results are available to NSA members as a member benefit. For more information, visit www.nsacct.org/nsafeestudy or call 800-966-6679.